
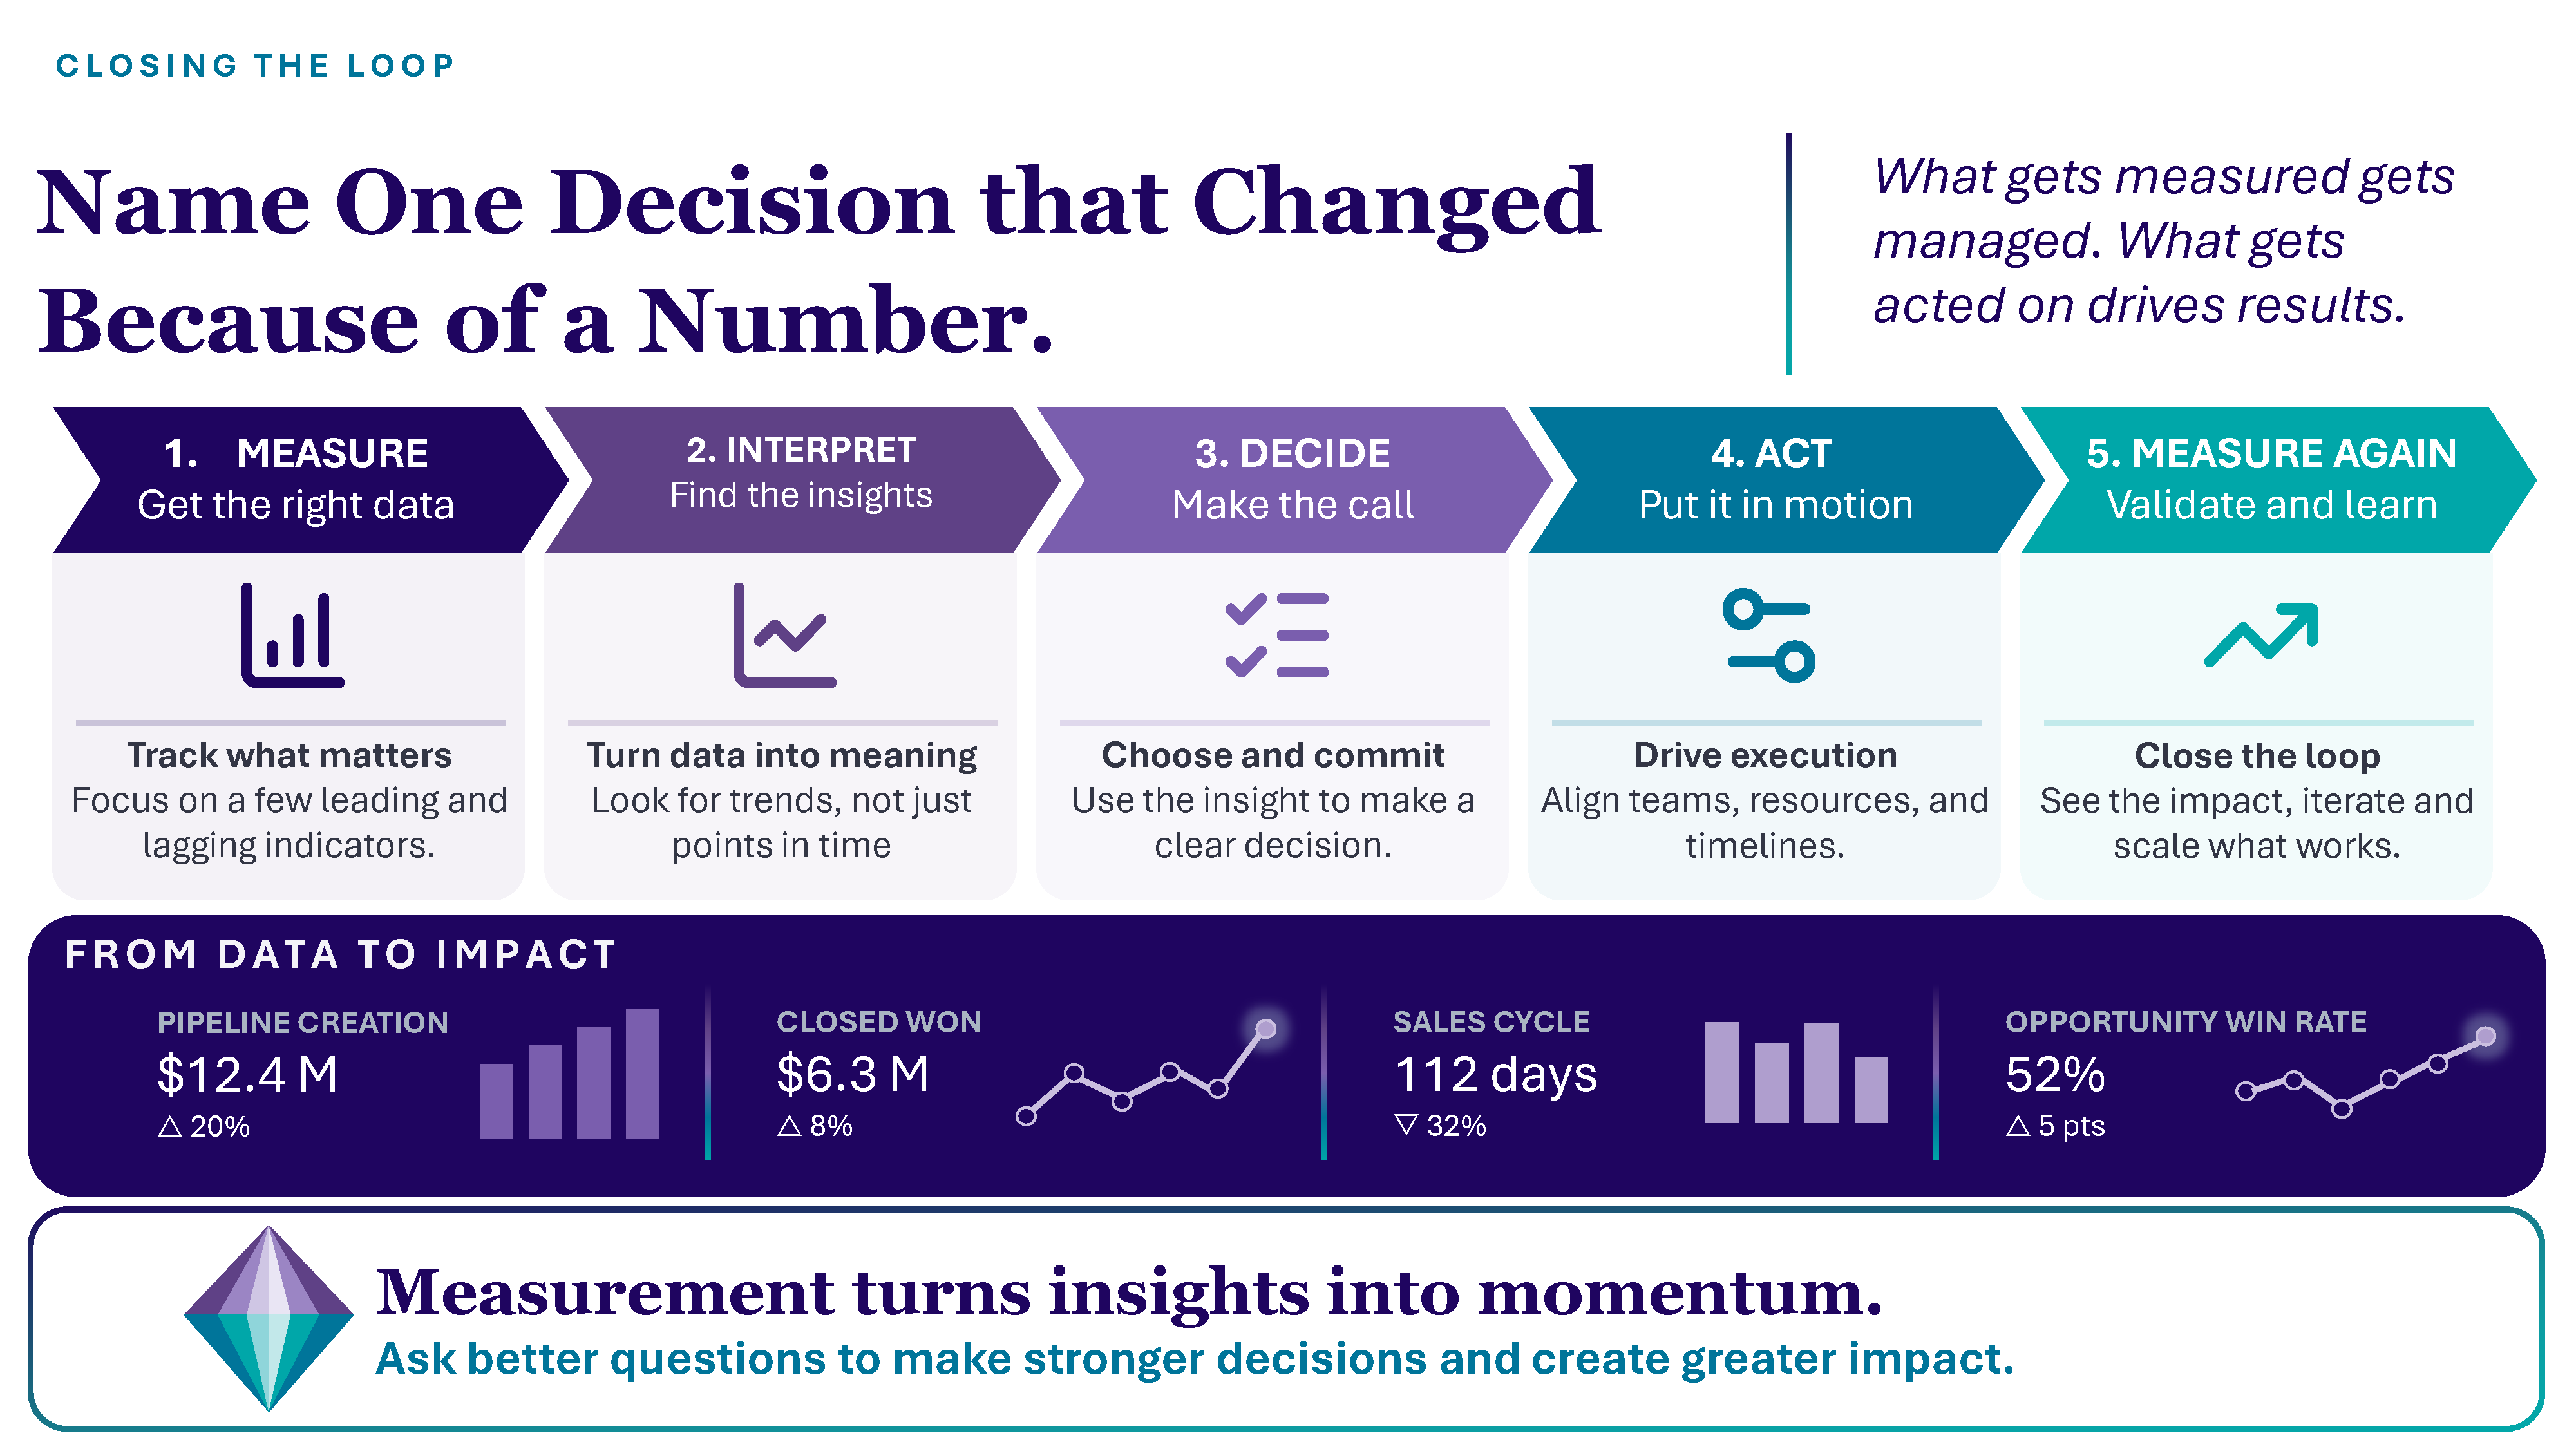
Name One Decision That Changed Because of a Number.
Think back over the last quarter and identify one decision the company made differently because of something a report or dashboard showed.
Not a decision the numbers confirmed after it was made. Not a result that earned a green arrow in the board deck. One decision that changed because the evidence pointed somewhere unexpected.
Most leadership teams need a minute to answer.
The minute is the finding.
The problem is rarely a lack of data. Most companies have more than anyone can absorb: campaign reports, CRM dashboards, pipeline reviews, forecasts, project updates, customer-health scores, service reports, and financial results.
Most of that reporting was built to describe what happened.
Describing what happened and changing what happens next are different jobs.
Effort is the easiest thing to count
When results slow, activity rises.
Marketing launches more campaigns and produces more content. Sales adds outreach, meetings, and account plans. Customer teams schedule more reviews and adoption programs. Leaders request additional dashboards so they can see whether the added work is helping.
The new reports fill with honest numbers: campaigns launched, calls made, meetings held, proposals sent, customers contacted, projects completed.
Teams need those measures. They show whether work occurred and help managers run the day-to-day operation.
Those measures say little about whether a prospect moved closer to a decision, an opportunity became more likely to close, a customer adopted what it bought, or the company became more likely to achieve its growth goal.
Measurement influences behavior, which makes the distinction important. What receives attention in the weekly review receives attention during the week. If the conversation centers on volume, teams learn to create volume. The company may become more efficient at producing activity without becoming more effective at producing movement.
The friction tax compounds when activity gets added to an unclear system. Reporting can keep that pattern alive when it makes the effort highly visible and the lack of movement difficult to see.
Separate effort, movement, and results
A useful measurement approach connects three different kinds of evidence without confusing them.
Effort measures show what a team did. Calls were made. Campaigns launched. Reviews completed. Implementations staffed.
Movement measures show whether prospects, opportunities, and customers advanced. A qualified opportunity entered the pipeline. A deal moved from discovery to proposal. A customer reached launch, adopted a key capability, demonstrated value, or became ready for renewal and expansion.
Business measures show whether that movement produced a valuable result. Bookings increased. Revenue grew. Retention improved. Expansion occurred. Margin strengthened. Customer value became visible.
A team can produce substantial effort without movement. Movement can occur without producing enough business value. A final business result can appear without revealing which actions contributed to it or whether it is likely to continue.
The three views belong together.
A CEO should be able to see not only whether the quarter ended above or below plan, but where customers moved, where they stalled, and what the company did that influenced the result.
The numbers need a shared language
Each function tends to measure the part of the customer journey it can see.
Marketing reports response, qualified leads, and pipeline creation. Sales reports opportunities, bookings, and forecast accuracy. Delivery reports launch status, service performance, and project completion. Account teams report customer health, retention risk, and expansion potential.
Every report can be internally correct while the company still lacks one coherent view of growth.
That is why operating reviews often begin with a debate about whose number is right. Marketing counts an opportunity when sales accepts it. Sales counts it after discovery. Delivery considers the customer live when the system is available. The account team considers the customer live when users have adopted it. One report shows progress while another shows delay.
The first twenty minutes go to reconciling definitions. Little time remains to decide what the evidence means.
A shared language starts with a few common questions at every meaningful stage of the customer journey.
How many entered? How many advanced? How long did movement take? What value, health, or risk resulted?
The specific measure changes. The logic does not.
Before the sale, movement may mean inquiry to qualified opportunity, discovery to proposal, or proposal to decision. After the sale, it may mean contract to launch, launch to adoption, adoption to demonstrated value, or value to renewal and expansion.
This connects directly to the handoff problem. If teams do not agree on what must be true before an account moves, the dashboard will reflect the disagreement rather than resolve it.
Start with the decision, not the dashboard
Many companies have designed a new measurement model in the last few years that is no longer used.
The dashboard was approved. The data was assembled. The reports were polished. Then the business returned to the meetings, habits, and decisions it already had.
The failure is often blamed on adoption or data quality. Those may be factors. The deeper problem is that the reporting was never tied to a recurring decision.
Forrester’s work on value-aligned management emphasizes that measures become useful when they drive shared value for customers and the business.. The dashboard matters only when it improves a decision.
The sequence should begin with the decision the company needs to make.
Should we continue investing in this segment? Should this opportunity remain in the forecast? Is this customer ready to expand? Is an implementation problem isolated or part of a pattern? Should this initiative continue, change, or stop?
Then work backward. What question must be answered? What evidence would improve the answer? Where will that evidence come from? When will it be reviewed? Who has the authority to act on it? What will show whether the decision was better?
That last question is essential because learning comes from examining what happened after the action and carrying that evidence into the next decision.
One changed decision is enough to begin
Closing the loop can sound like a large analytics program. It does not have to start that way.
Choose one recurring decision that matters and identify the smallest amount of evidence needed to improve it.
I have seen leadership teams spend months trying to perfect an executive dashboard while continuing to make the same choices from habit. The shift comes when the review begins with a live decision rather than a tour of the numbers.
Consider a company deciding how much to invest in a target segment. Activity measures may show strong campaign response and a healthy number of first meetings. Movement measures may reveal that few opportunities reach proposal and those that do take much longer than the rest of the pipeline. Delivery evidence may show that the segment requires costly exceptions. The right decision may be to refine the offer, change qualification, reduce investment, or stop treating the segment as a priority.
The report became useful when the weak performance changed what the company chose to do.
A closed-loop review asks five questions in sequence. What did we expect? What happened? What explains the difference? What decision changes? What will tell us whether the change helped?
Those questions can improve a pipeline review, customer-health discussion, roadmap meeting, or leadership session without creating another layer of reporting.
Visibility is the means. Adaptation is the point.
Evidence should travel back upstream.
Which customers convert should influence who the company targets. Which deals stall should influence qualification, proof, and sales practice. Which promises create delivery friction should influence positioning and scope. Which customers adopt and expand should influence the offer and the experience around it.
When evidence changes those choices, the company becomes more accurate over time by recognizing what reality is showing and responding before the cost compounds.
When the loop remains open, the company can report the same pattern for several quarters without changing the assumptions that produced it. The segment stays on the roadmap. The opportunity remains in the forecast. The campaign continues because engagement looks good. The customer remains “healthy” until the renewal is already in danger.
This is why the four decisions need a recurring decision rhythm behind them. Evidence should change whether an initiative is now, later, uncertain, or no longer worth doing.
Before the next board deck is assembled, ask:
If the reporting had shown something different last quarter, would the company have done anything differently? Can someone name the decision, the evidence that changed it, and what happened afterward?
If the answer is no, the reporting remains a record rather than a source of better decisions.
The distinction becomes even more important as AI increases the speed of analysis, recommendations, and action. Faster confusion examines what happens when faster decisions enter a business that has not decided what evidence should change its direction.
A number earns executive attention when it changes a decision and the company learns from what happened next.

Would last quarter's reporting have changed a single decision if the numbers had been different?
The ArdentLights Clarity Diagnostic helps identify whether measurement is guiding action or only documenting activity.
Take the Clarity Diagnostic→